Practical Data Visualization with the Bar Chart Icon
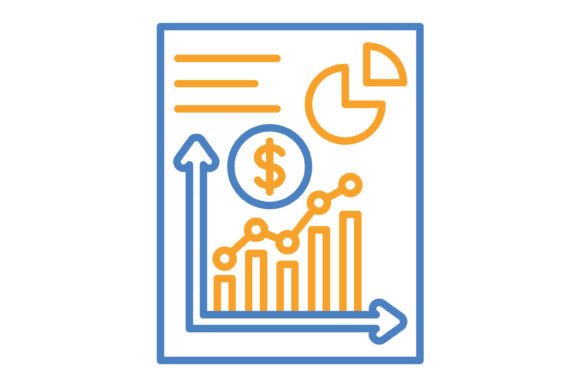
When you are building a presentation or refining a mobile app, the clarity of your data presentation can make or break the user experience. We often focus heavily on typography and color palettes, but the icons that represent complex data deserve the same level of attention. The Bar Chart Blue & Orange Line Icon is a design asset built specifically for this purpose. It is not just a decorative element; it is a functional tool designed to communicate growth, comparison, and metrics instantly.
Visually, this icon strikes a balance between professional neutrality and energetic highlight. The blue bars typically represent the baseline or historical data, conveying stability and trust—a staple in corporate design and web design. The orange bars introduce a pop of contrast, perfect for indicating current status, highlights, or areas needing attention. This specific color pairing is a classic in modern typography and data visualization because it offers high contrast without being jarring. The line art style keeps the interface looking clean and uncluttered, ensuring that the icon scales beautifully whether it is viewed on a high-resolution retina display or printed in a small format.
Where This Icon Fits Best
The versatility of the Bar Chart Blue & Orange Line Icon makes it a valuable addition to nearly any creative toolkit. Its primary strength lies in digital environments. If you are a developer or designer working on a mobile app, this icon fits perfectly into dashboards, analytics screens, or settings menus. Because it is included in formats like SVG and EPS, it remains crisp and sharp at any size, which is essential for responsive design.
However, its utility extends far beyond screens. For print projects, such as annual reports, brochures, or packaging design, the vector nature of the AI and EPS files ensures that the lines remain perfectly smooth, even when blown up to poster size. Entrepreneurs and small business owners will find it particularly useful for presentation design. Instead of using generic clip art, using a high-quality vector icon elevates the perceived value of your pitch. It signals to your audience that you pay attention to details, which is a subtle but powerful component of brand identity.
Integrating Icons into Your Visual Hierarchy
Icons act as visual anchors. When a reader scans a page or a slide, their eyes are naturally drawn to imagery before they settle on text. By using the Bar Chart Blue & Orange Line Icon, you are creating an entry point for your data. It helps establish a visual hierarchy that guides the viewer’s understanding. For example, placing this icon next to a "Revenue" heading immediately contextualizes the text that follows.
In terms of brand perception, consistency is key. If you are using a specific shade of blue and orange in your logo or typography, you can easily edit this vector icon to match those exact hex codes. This cohesion turns a standard design asset into a bespoke piece of your brand puzzle. It prevents your materials from looking like a patchwork of different styles and reinforces a professional, polished look.
Practical Application and File Formats
The download package is designed for maximum usability, including five distinct formats: AI, EPS, JPG, PNG, and SVG. This variety removes the technical barriers that often slow down creative workflows. Here is how you can practically apply these formats:
- SVG (Scalable Vector Graphics): This is the gold standard for web design. The SVG format is lightweight and code-based, meaning it loads instantly on websites. It is perfect for responsive layouts where the icon might resize depending on the user's device.
- PNG (Transparent Background): Essential for social media graphics and quick mockups. The transparent background allows you to place the icon over complex textures or colored backgrounds without a white box appearing around it.
- AI and EPS: These are the master files for designers using Adobe Illustrator or similar software. If you need to change the thickness of the lines, alter the colors to fit a specific font pairing, or combine this icon with other elements, these formats give you full control.
- JPG: Best for situations where file size is a concern and transparency isn't needed, such as quick email attachments or legacy systems.
Making It Work for Your Project
When incorporating the Bar Chart Blue & Orange Line Icon into your work, consider the surrounding environment. If you are using a sans serif font with a modern, geometric style, this icon will complement it perfectly due to its clean lines. If your design leans toward a more traditional serif font aesthetic, the icon provides a necessary modern counterpoint that keeps the layout from feeling dated.
Ultimately, this icon is about clarity and professionalism. Whether you are a blogger illustrating a financial tip, a marketer designing an infographic, or a crafter creating a template for sale, this asset is ready to use. It saves you the time of drawing charts from scratch and ensures your visual communication is effective and engaging.